Blog Archives
Resource Governor at Work with Azure Pack
WAP administrators can use the functionality of SQL Server 2014 Resource Governor with UR5 of Windows Azure Pack. You can read about ‘Manage tenant database workloads with resource governor in WAPack’ here. In this blog post I am detailing the last section ‘Resource Governor at Work’ of the above blog post.
Tools available to generate load on SQL server
Though we can write custom tools (C#, PowerShell) etc. to create test databases and generate load, sometimes publically available tools will come handy. Providing two tools that I have come across.
- Hammer DB (I have used this for various load generation, benchmark verification before/after changing server configuration etc.)
- SQL Load Generator
View CPU Usage for Resource Pools
In this post, I assume that you have followed the instructions provided in the above blog post. In my configuration, I have created the suggested resource pools and created a database named ‘contoso’. I am providing the steps to identify the resource pool name and how to view the performance counters for the resource pool.
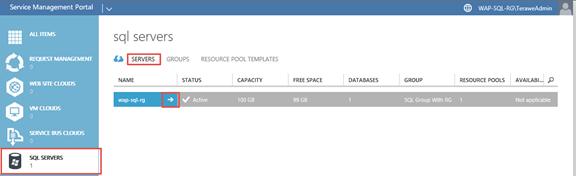
Step 1: Identify the resource pool associated with the database
As a service provider administrator, navigate to ‘servers‘ tab in ‘SQL Servers‘ resource provider and navigate to the details of specific server.
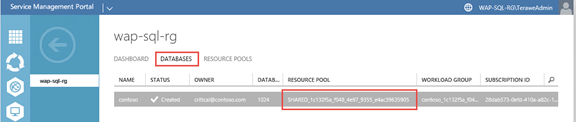
Navigate to the ‘databases‘ tab and find out the ‘resource pool name’.
Step 2: Open performance monitor
You can do this by running ‘perfmon’ on windows run prompt.
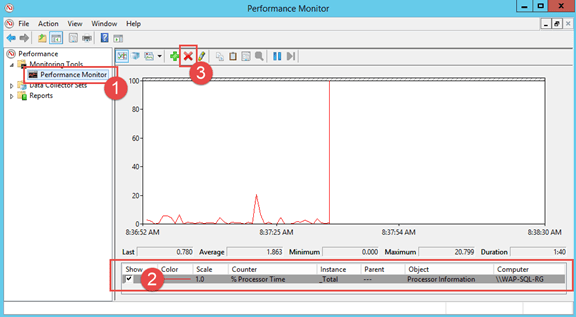
- Navigate to the performance monitor view
- Select any existing counters
- Click on ‘Delete’ to remove the existing counters
- Click on ‘+’ button next to add new counters (in the following step)
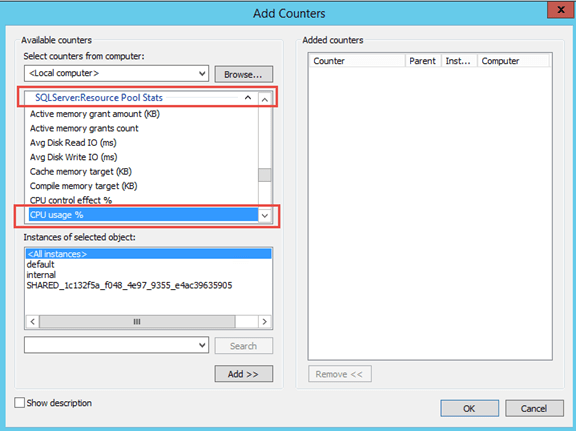
Step 3: Add SQL Resource Governor Performance Counter
-
Choose counter ‘CPU usage %‘ in ‘SQL Server: Resource Pool Stats‘
Note: You can see that all the resource pools you saw along with databases tab in windows azure pack + two system resource pool instances (default & internal) are listed in the instances section
- Now you can select all instances and click on ‘Add‘ button.
Step 4: Generate load against the databases and watch usage in performance monitor
